Prometheus vs Nagios vs Grafana: 2026 Full Comparison
Listen to this article
Your production server just went dark at 2 AM. Every second of downtime costs money, reputation, and sleep. The difference between a five-minute fix and a five-hour war often comes down to one thing — having the right monitoring tool watching your infrastructure before everything breaks. When it comes to the Prometheus vs Nagios vs Grafana debate in 2026, teams are no longer just picking a tool. They're deciding how fast they can see problems, understand them, and act.
These three tools dominate the open-source monitoring space, but they don't all do the same job. One was built for cloud-native, container-heavy environments. One has been keeping servers alive since the late 1990s. And one turns raw metric data into dashboards that even non-engineers can read at a glance. Picking the wrong one — or misunderstanding how they fit together — creates blind spots that cost you at the worst possible moment.
So before you copy a stack from a blog post or default to "what your last company used," take ten minutes to read this. We'll cover how Prometheus vs Nagios vs Grafana actually differ across architecture, alerting, data collection, Kubernetes support, visualization, pricing, and real-world use cases — so you walk away with a clear answer. Every section maps directly to how Prometheus vs Nagios vs Grafana behaves in production — not just on paper.
What Are Prometheus, Nagios, and Grafana? Understanding the Core Roles
Before jumping into the head-to-head numbers and feature tables for Prometheus vs Nagios vs Grafana, understand what each tool actually does — because one of the most common mistakes teams make is treating all three as direct competitors. They aren't. They play different roles, and in many production environments, they work together.
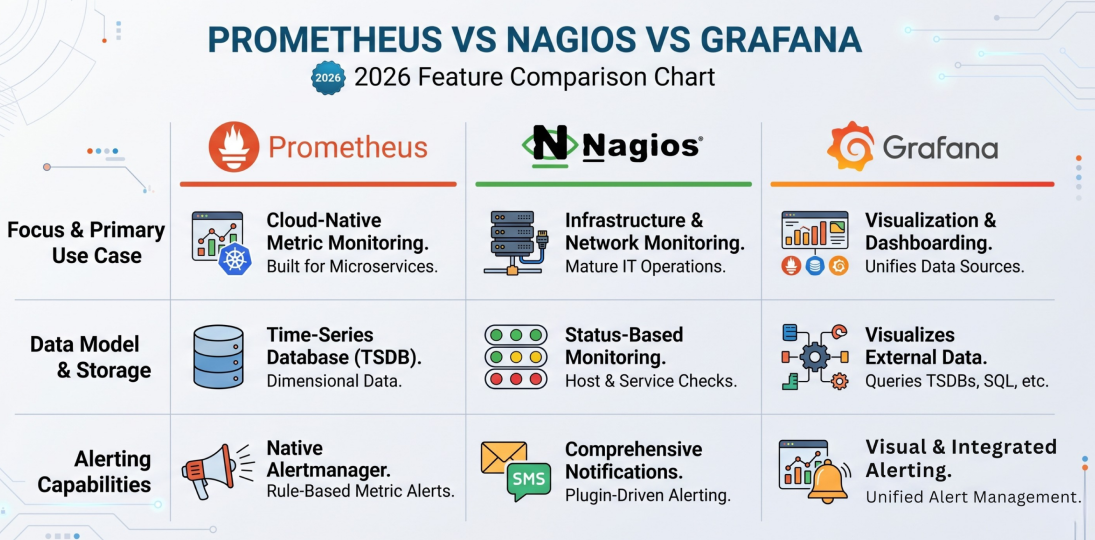
- Prometheus is an open-source monitoring and alerting toolkit that started at SoundCloud in 2012. Today, it's a graduated project under the Cloud Native Computing Foundation (CNCF). Prometheus collects metrics from your services at defined intervals, stores them in a built-in time-series database, evaluates alerting rules, and sends notifications when thresholds are breached. Its query language — PromQL — gives DevOps and SRE teams a powerful, flexible way to slice, aggregate, and analyze live data. Prometheus excels in cloud-native environments where containers and microservices spin up and disappear dynamically.
- Nagios is the veteran of the group. Originally released in 1999 under the name NetSaint, Nagios became the go-to monitoring system for IT operations teams managing physical servers, networks, and traditional applications. It performs active checks using plugins installed on hosts and network devices, and it alerts based on simple exit codes — OK, WARNING, CRITICAL, or UNKNOWN. Nagios has no query language, no label-based data model, and no native support for dynamic service discovery. What it does have is battle-tested stability, more than 1,000 community-built plugins, and a straightforward approach to uptime monitoring that still works extremely well for legacy infrastructure.
- Grafana is neither a monitoring tool nor an alerting engine. First and foremost, Grafana is a visualization and analytics platform. It doesn't collect or store metrics on its own — instead, it connects to data sources like Prometheus, InfluxDB, Elasticsearch, and even Nagios, and transforms that raw data into interactive, shareable dashboards. Engineers use it to build real-time performance views; managers use it to track SLAs; on-call teams use it to spot anomalies at a glance. Grafana also has a built-in alerting layer, but that layer still depends entirely on an upstream data source to work.
In short: Prometheus is the engine. Nagios is the watchdog. Grafana is the window through which your whole team sees both.
Prometheus vs Nagios vs Grafana: Architecture and How Data Gets Collected
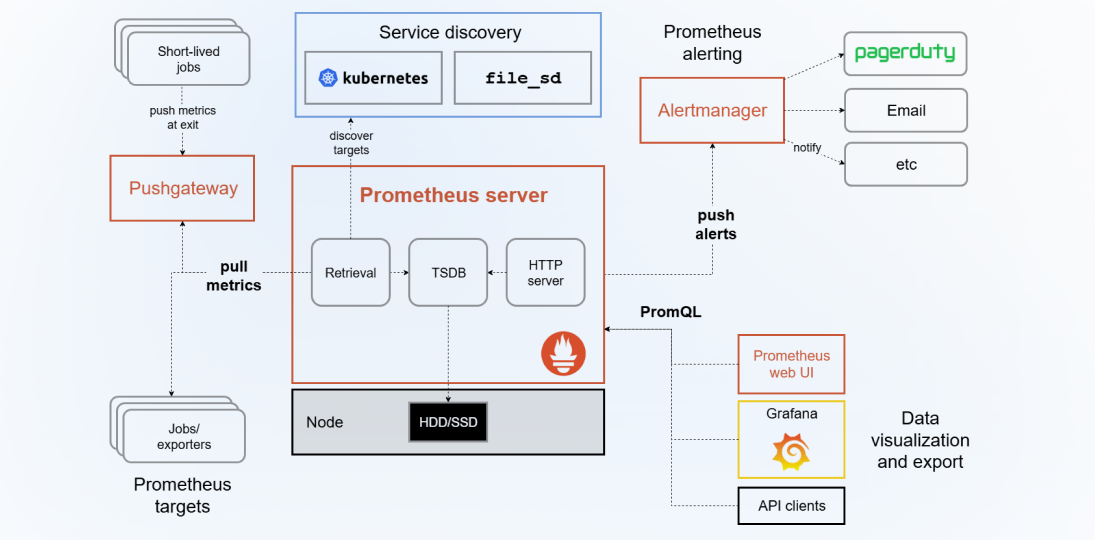
The biggest practical difference in the Prometheus vs Nagios vs Grafana setup isn't features — it's how each tool collects data. That architectural choice shapes everything downstream: what you can monitor, how quickly you can scale, and how much manual work your team has to do.
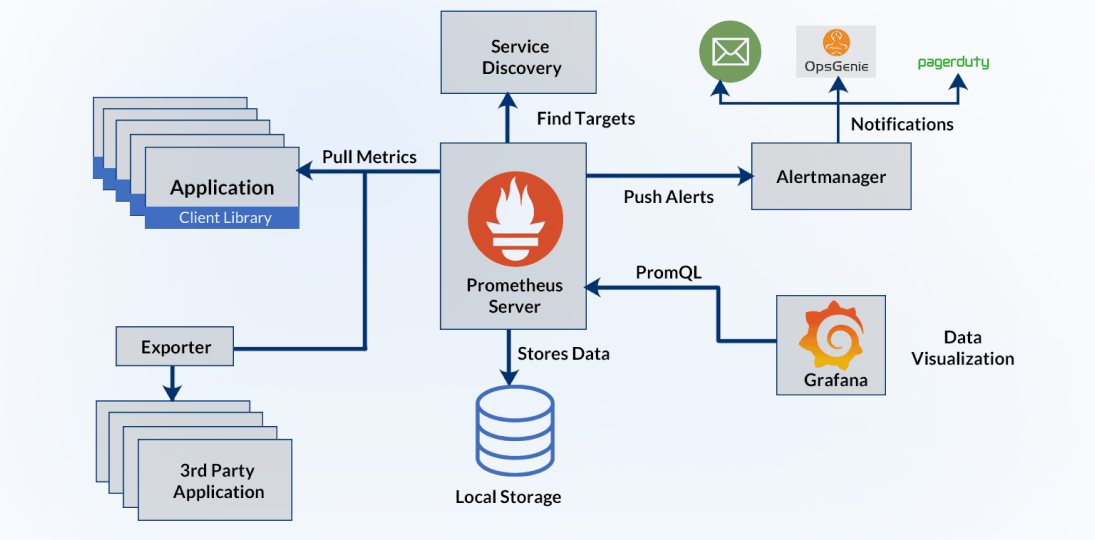
Prometheus uses a pull model. Every service you want to monitor exposes an HTTP endpoint that Prometheus scrapes at regular intervals — typically every 15 to 30 seconds. When a service can't expose metrics directly (say, a MySQL database or a Linux node), you deploy a Prometheus exporter: a lightweight sidecar that translates third-party metrics into Prometheus format. There are hundreds of exporters available for databases, message queues, cloud providers, operating systems, and more. Because Prometheus actively reaches out to targets, it always knows which services exist and whether they're healthy. If a service disappears, Prometheus knows immediately.
Nagios, on the other hand, runs on an active check model. It deploys agents — most commonly NRPE (Nagios Remote Plugin Executor) — on remote hosts, uses SNMP to poll network devices, and relies on WMI for Windows machines. Each check runs on a schedule and returns a binary status code. The result tells you whether a service is up or down, but not much more. There's no concept of labels, metric cardinality, or data dimensions the way Prometheus handles them. Moreover, every new host or service you want to monitor must be manually added to Nagios's configuration — or managed through additional scripting — which gets tedious fast in dynamic environments.
Grafana, by design, has no data collection layer. You point it at a data source, write a query, and it renders the result. Additionally, Grafana's support for dozens of data sources means you can combine Prometheus metrics, CloudWatch data, and application logs into a single unified dashboard — something neither Prometheus nor Nagios can do on their own.
For teams running containers, Kubernetes clusters, or any kind of auto-scaling infrastructure, Prometheus's pull-based architecture wins outright. For teams running fixed infrastructure that doesn't change week to week, Nagios's active check model is perfectly adequate — and far simpler to reason about.
Query Power: PromQL vs Nagios's Check Model — A Key Prometheus vs Nagios Difference
This is where the gap between Prometheus and Nagios becomes most obvious for modern engineering teams.
Prometheus uses a multi-dimensional data model. Every metric carries a name and a set of key-value labels that describe it — things like job, instance, environment, region, or pod_name. PromQL, Prometheus's query language, lets you filter, aggregate, and calculate across any combination of these dimensions. Want the 95th percentile request latency broken down by microservice, environment, and Kubernetes namespace? That's a single PromQL expression. Want to calculate the error rate over a rolling 5-minute window and compare it to last week? Also a single query. This kind of analysis is foundational for SRE teams managing SLOs and error budgets.
Nagios has no query language at all. Each host gets services, each service runs one check, and that check returns a status plus an optional perfdata string. Teams sometimes pipe that perfdata into an external time-series system like Graphite, but doing so requires extra tooling, configuration, and maintenance. For organizations that need deep application-layer analysis or trend modeling, this limitation is hard to work around.
Grafana, when connected to Prometheus, inherits the full power of PromQL through its Explore panel and dashboard query builder. In practice, this combination — Prometheus for storage and Grafana for querying and visualization — has become the de facto standard in cloud-native monitoring in 2026. Many teams build their entire observability workflow around it.
Alerting Compared: Who Handles Alerts Best in Prometheus vs Nagios vs Grafana?
All three tools have alerting built in, but the sophistication of those systems differs enormously.
Prometheus ships with Alertmanager — a dedicated microservice for the full lifecycle of an alert. Alertmanager handles grouping — so a single degraded service doesn't fire 200 individual pages. It handles routing, sending database alerts to the DB team and API alerts to backend engineers. It handles deduplication so on-call engineers aren't paged three times for the same incident. And it handles silencing so planned maintenance windows don't wake anyone up unnecessarily. Alert rules live in YAML files and evaluate against live metric data continuously. You can write rules like "if the 5-minute error rate exceeds 2% for more than 3 consecutive minutes, fire a critical alert" — far more nuanced than any threshold-based system.
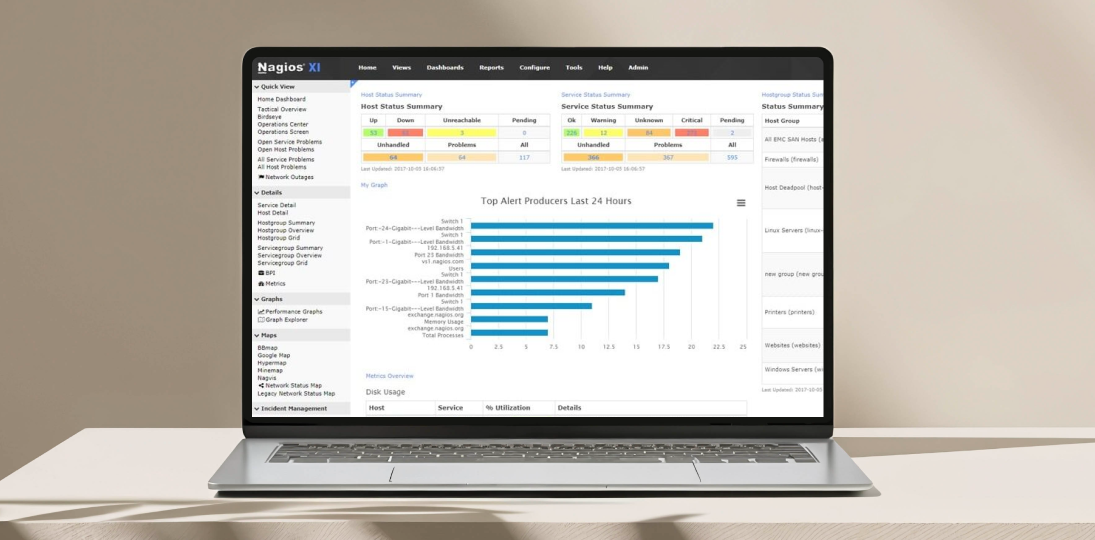
Nagios uses a check-and-notify model that's simpler by design. When a service check returns CRITICAL, Nagios notifies a configured contact via email or SMS. That model works well for binary events — a server is either up or down — but it falls short when you need to suppress noise, route alerts intelligently, or build escalation policies. There's no native grouping or deduplication. Achieving anything close to Alertmanager's behavior in Nagios requires Nagios XI (the commercial version) or extensive plugin customization.
Grafana's Unified Alerting, which has matured through Grafana versions 9, 10, and beyond, now lets you define alert rules directly inside dashboards against any connected data source. In 2026, it supports multi-dimensional alerts, contact points, notification policies, and silence management — functionality that mirrors much of what Alertmanager offers. Nevertheless, since Grafana's alerting relies on querying an external data source, it introduces an additional dependency that pure Prometheus alerting doesn't have. If your visualization layer goes down, your alerts go down with it.
For distributed systems and large engineering teams, Prometheus + Alertmanager remains the most reliable alerting foundation. Grafana Unified Alerting is an increasingly strong option — particularly for teams that want to keep alert management inside the same tool where they build dashboards.
Visualization: Where Grafana Runs Away from Both Prometheus and Nagios
Honestly, this section is over quickly. Grafana wins - and its isn't close.
Prometheus ships with a basic expression browser that lets you run PromQL queries and view the results as a simple time-series graph or a data table. It's functional for quick debugging but not remotely suitable for production dashboards, cross-team sharing, or executive reporting. There's no way to build multi-panel layouts, persist dashboard configurations, or create anything visually meaningful in native Prometheus. As a result, the overwhelming majority of Prometheus users add Grafana on top as the first additional tool they install.
Nagios provides status-focused dashboards — tables showing host and service states, alert history, and network topology. These views are genuinely useful for NOC (Network Operations Center) teams doing availability monitoring. Furthermore, Nagios XI adds more polished reporting for capacity planning and trend analysis. Still, neither version supports the level of graph customization, data overlays, or analytical depth that modern engineering teams expect.
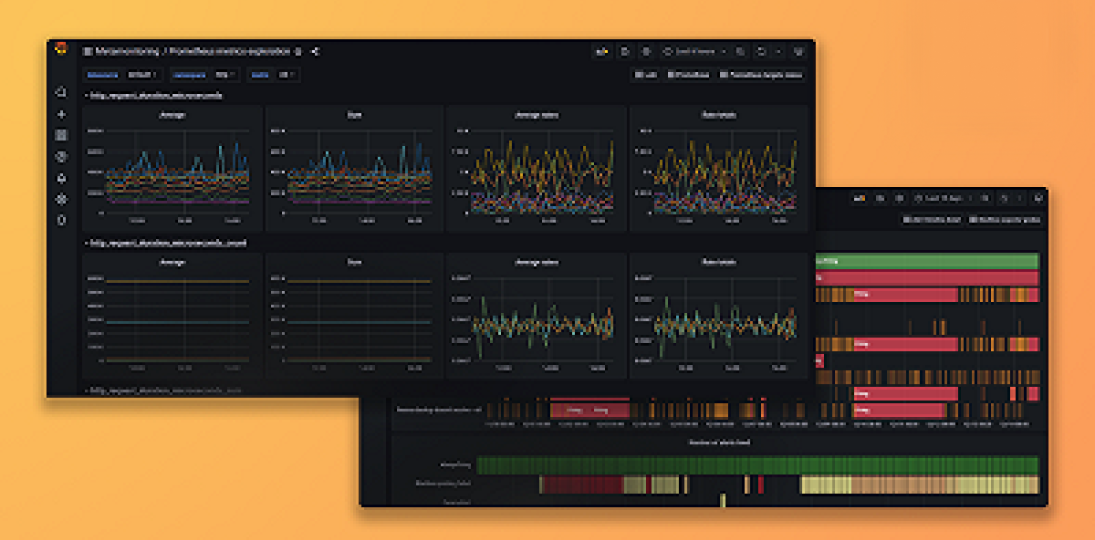
Grafana, in contrast, supports dozens of panel types: time-series graphs, heatmaps, stat panels, bar gauges, world maps, histograms, Sankey diagrams, and more. Its variable system lets you build dynamic dashboards where a dropdown filters data across every panel simultaneously. Meanwhile, Grafana's plugin marketplace offers hundreds of community-contributed extensions for additional visualization types and data sources. Beyond metrics, Grafana also connects to Loki for log aggregation and Tempo for distributed traces — making it the single pane of glass for metrics, logs, and traces in one interface.
For any team that needs more than a raw graph, Grafana isn't optional — it's the standard.
Kubernetes and Cloud-Native: How Prometheus vs Nagios vs Grafana Handle Modern Infrastructure
This section matters enormously in 2026. According to the CNCF Annual Survey, over 84% of organizations now run Kubernetes in production — and Prometheus is the most-used monitoring tool in those environments, deployed by more than 73% of respondents.
Prometheus was purpose-built for this environment. Its Kubernetes service discovery is native — Prometheus can automatically find pods, services, ingresses, and endpoints without any manual configuration. The Prometheus Operator, a widely used Kubernetes controller, lets teams define monitoring configurations as Kubernetes CRDs (Custom Resource Definitions) and version-control them alongside application code. Kube-state-metrics and the Node Exporter provide deep cluster-level visibility out of the box. In addition, virtually every major managed Kubernetes platform — including GKE, EKS, AKS, and OpenShift — ships with Prometheus-compatible metrics endpoints pre-configured.
One honest limitation: Prometheus's local storage isn't designed for long-term retention. For historical queries and multi-cluster aggregation, teams typically add Thanos or Cortex — both CNCF projects built specifically to extend Prometheus at scale. These tools add object storage backends (S3, GCS) and global query federation across hundreds of Prometheus instances.
Nagios was designed for static, on-premise environments, and it shows in cloud-native contexts. Adding a new Kubernetes pod to Nagios monitoring means updating config files — manually, or through scripts. There's no native understanding of ephemeral workloads, rolling deployments, or horizontal pod autoscaling. For teams running hybrid infrastructure where legacy servers sit alongside Kubernetes clusters, Nagios and Prometheus often coexist: Nagios handles the physical layer, Prometheus handles the container layer.
Grafana scales horizontally without issue. Grafana Cloud, its managed SaaS offering, handles the entire observability backend — including hosted Prometheus, Loki, and Tempo — so teams can focus on building dashboards rather than managing infrastructure.
Pricing: Open-Source Roots and Enterprise Costs in 2026
All three tools in the Prometheus vs Nagios vs Grafana comparison are open-source at their core, but their commercial paths differ.
- Prometheus is free under the Apache 2.0 license with no paid tiers from the project itself. Managed Prometheus-compatible services are available from Grafana Cloud, AWS (Amazon Managed Service for Prometheus), and Google Cloud — all charged based on metric volume ingested.
- Nagios offers Nagios Core for free and Nagios XI (the enterprise version) starting at approximately $3,495 per year. Nagios XI adds a cleaner web interface, built-in reporting, capacity planning charts, and access to commercial support. Nagios Log Server and Nagios Network Analyzer are sold separately, which means building a full monitoring platform around Nagios can add up quickly.
- Grafana offers a fully featured open-source version (Grafana OSS) at no cost. Grafana Cloud's free tier covers up to 10,000 active metric series with 14-day retention, 50 GB of logs, and 50 GB of traces — generous enough for small teams and side projects. Paid plans start at around $8/month and scale with data volume. Grafana Enterprise, for large self-hosted deployments, adds SAML/SSO support, advanced data source connectors, and audit logging.
For teams on tight budgets, the Prometheus + Grafana OSS combination delivers enterprise-grade observability at zero licensing cost. The only investment is in engineering time to set it up and maintain it.
Prometheus vs Nagios vs Grafana: Side-by-Side Comparison (2026)
Which Monitoring Tool Should You Choose in 2026?
The honest answer: most teams don't choose just one. But your infrastructure type tells you where to start.
- Go with Prometheus if your workloads run in containers, Kubernetes, or any cloud-native environment. It integrates natively with every major container platform, discovers services automatically, and gives your SRE team the PromQL depth needed to build meaningful SLOs. If you're starting from scratch in 2026, Prometheus is the default choice for time-series monitoring.
- Stick with Nagios (or add it) if you're managing traditional infrastructure — bare-metal servers, Windows machines, network switches, or legacy applications where uptime and availability monitoring are the core requirement. Nagios's 1,000+ plugin library gives it remarkably broad coverage, and its check-based model is straightforward to configure and reason about. In hybrid environments, many teams run Nagios alongside Prometheus without conflict.
- Add Grafana regardless of which you choose. Grafana isn't a competitor to Prometheus or Nagios — it's the layer that makes both of them usable by your entire organization. Whether you're pulling Prometheus metrics for a Kubernetes cluster or displaying Nagios check states in an operations dashboard, Grafana handles the presentation. In 2026, the most common and recommended observability stack is Prometheus + Grafana for cloud-native monitoring, with Nagios potentially co-existing for legacy infrastructure in hybrid setups.
Frequently Asked Questions: Prometheus vs Nagios vs Grafana
Q: Can Prometheus replace Nagios completely?
For cloud-native infrastructure, yes — Prometheus handles metric collection, service discovery, and alerting better than Nagios in container environments. Nevertheless, for traditional network monitoring, legacy server checks, and SNMP-based device polling, Nagios still does things Prometheus doesn't support natively. Most enterprise teams running hybrid infrastructure keep both.
Q: Do I need Grafana if I already use Prometheus?
Technically, no. Prometheus has a built-in expression browser. In practice, though, almost every team adds Grafana because the difference in usability, dashboard sharing, and visualization depth is enormous. Prometheus's UI is a debugging tool; Grafana is a full observability platform.
Q: Is Grafana free to use?
Grafana OSS (self-hosted) is completely free under the Apache 2.0 license. Grafana Cloud has a free tier covering 10,000 active metric series and 50 GB of logs. Paid plans start at around $8/month for additional retention, data volume, and team features.
Q: What is PromQL and do I need to learn it?
PromQL is Prometheus's query language. It's what you use to filter, aggregate, and calculate metrics stored in Prometheus. If you're using Grafana as your dashboard layer, you write PromQL inside Grafana's query editor. It has a learning curve but is well-documented, and for anyone managing Kubernetes or microservices, learning it properly pays off fast.
Q: Which tool is best for Kubernetes monitoring in 2026?
Prometheus is the standard for Kubernetes monitoring. It integrates natively with Kubernetes service discovery, works with the Prometheus Operator for declarative configuration, and is supported out-of-the-box by GKE, EKS, AKS, and most other managed Kubernetes platforms. Pair it with Grafana for dashboards and Alertmanager for routing.
Final Thoughts
The Prometheus vs Nagios vs Grafana comparison doesn't have a single winner — it has a right answer for each use case. Prometheus is the engine behind modern cloud-native observability. Nagios is the proven, no-nonsense guardian for traditional infrastructure. Grafana is the interface that makes both of them accessible, shareable, and genuinely useful across your whole organization.
If you're building a new monitoring stack in 2026, start with Prometheus and Grafana. If you're managing legacy systems, keep Nagios working alongside them. And if you're unsure how to put it all together for your specific environment, that's exactly the kind of problem we solve at Ellocent Labs.
Our team has hands-on experience designing and implementing DevOps observability stacks — from Kubernetes monitoring pipelines and custom Prometheus exporters to full Grafana dashboard frameworks for engineering and business teams. We also have a broader guide covering how Prometheus, Grafana, Nagios, and Site24x7 compare as a four-way IT monitoring review if you want to explore additional tooling options. To discuss what the right stack looks like for your business, reach out to our team directly — we're happy to talk through your requirements.
Not sure which approach is right for your project?
We've built both. We'll tell you honestly which one fits.
From no-code MVPs validated in 6 weeks to enterprise AI platforms with 50,000+ users, we've built across the whole range. Book a consultation and we'll tell you honestly which approach fits your budget, your timeline, and your scale ambitions.
Book a discovery call